Pockets of Poverty: A Finer Lens on Utility Affordability and Equity
By Elizabeth Jurado
Providing essential services like energy and water is costly. In the case of water, increasingly so, with water rates increases outstripping inflation in the last couple of decades. In terms of energy, bills tend to be higher than water bills, and the southeastern US has some of the highest energy burdens in the country. Water and energy utilities must contend with aging infrastructure, changes in population, climate and environmental adaptation, cybersecurity measures, and requirements to protect public health and the environment.
A 2023 report estimated an 8% increase in capital and operating costs faced by water and wastewater utilities year-over-year. In the wake of their increasing costs, utilities must consider raising rates - driving concerns of water affordability to the forefront (D'Silva et al., 2023; EPA, 2024). So, how do decision-makers know if their utility has an affordability issue?
Characterizing financial distress at the community level is critical to helping decision-makers allocate resources where they are needed most. Over the past decade, tools like EJScreen and the Climate and Economic Justice Screening Tool (CEJST) have advanced this effort by combining environmental and demographic data to map economic and environmental burdens across the country. As national-level screening tools, they were designed to offer broad data coverage while balancing limitations in data quality and resource availability (EPA, 2021). These tools have recently been removed from federal websites and are now only accessible through unofficial archives. This lack of formal stewardship casts doubt on their long-term availability and relevance. Without regular updates and oversight, they risk becoming outdated and losing credibility—particularly when used to inform critical resource allocation decisions.
While speaking to economic distress, these tools were not designed to answer localized, utility-scale questions about impacts to rate-payer affordability. (e.g. Is the proposed rate increase for a particular utility affordable to that utility’s customer base?) At ibE, we've spent considerable time exploring how best to measure affordability at the utility scale. This is why we developed Pockets of Poverty™(PoPs) - an internal mapping tool that combines high-quality national datasets with custom boundaries - mapping socioeconomic indicators at the Census Tract level.
PoPs™ offers two unique characteristics. First, it includes actual bill data, which is useful to a utility that knows exactly, e.g. the cost of 5,000 gallons of water today, and the cost of that same amount of water after the recommended rate increase. Secondly, PoPs addresses some of the incongruence of utility service area compared to city/county data, as illustrated below.

Figure 1. Cherokee County’s Median Household Income (MHI) (GAWP, Water Operator Summer 2022)
Why Boundaries Matter in Affordability Assessments
Affordability assessments often rely on jurisdictional boundaries—such as cities or counties—but these rarely align with the actual service areas of utilities. Since socioeconomic data from the Census is typically reported along these jurisdictional lines, there’s often a disconnect between the data and the utility’s true customer base.
To address this gap, this mapping model uses custom utility boundaries to align data more accurately with service areas. The example of Waleska, GA illustrates this challenge: the city's water utility serves customers across multiple jurisdictions, yet standard assessments based on county-level data can be misleading. For instance, Cherokee County’s Median Household Income (MHI) is $86,404, while the City of Waleska’s is just $55,417—a 36% difference. Relying solely on county data could mask significant affordability concerns within the utility’s service area.
Conversely, large utilities that span several jurisdictions face the opposite problem—no single boundary reflects the full range of households served. By analyzing data at the Census Tract level within custom service boundaries, we gain a more accurate and equitable view of economic conditions. This localized approach ensures all communities within a utility’s reach are considered in affordability planning and funding decisions.
Integrating Actual Bill Data
And the other factor that has been missing in most national mapping models is the ability to accommodate actual utility bill data. A utility wanting to see how an increase in its stormwater utility fee will affect affordability and equity for its customer base would ideally be able to enter the actual before and after fee increase to view the difference in affordability. The ability to enter these actual bills is a feature built into the PoPs™ mapping model.
In the maps below, total water burden (actual water, wastewater and stormwater bills/fees) are included, first using the MHI, then using the 20th percentile. The second map highlights more financial distress. In other scenarios, these maps have been used to show before vs after a rate increase. Learn more about measuring burden, in our Transitioning to Clean Energy Post.
Monthly Water Burden for City of Waleska Service Area
Based on a water bill of 5,000 gallons is approximately $50
(Here the black solid line is the utility boundary, whereas the dotted lines show the individual Census Tracts that intersect with the utility’s service area.)
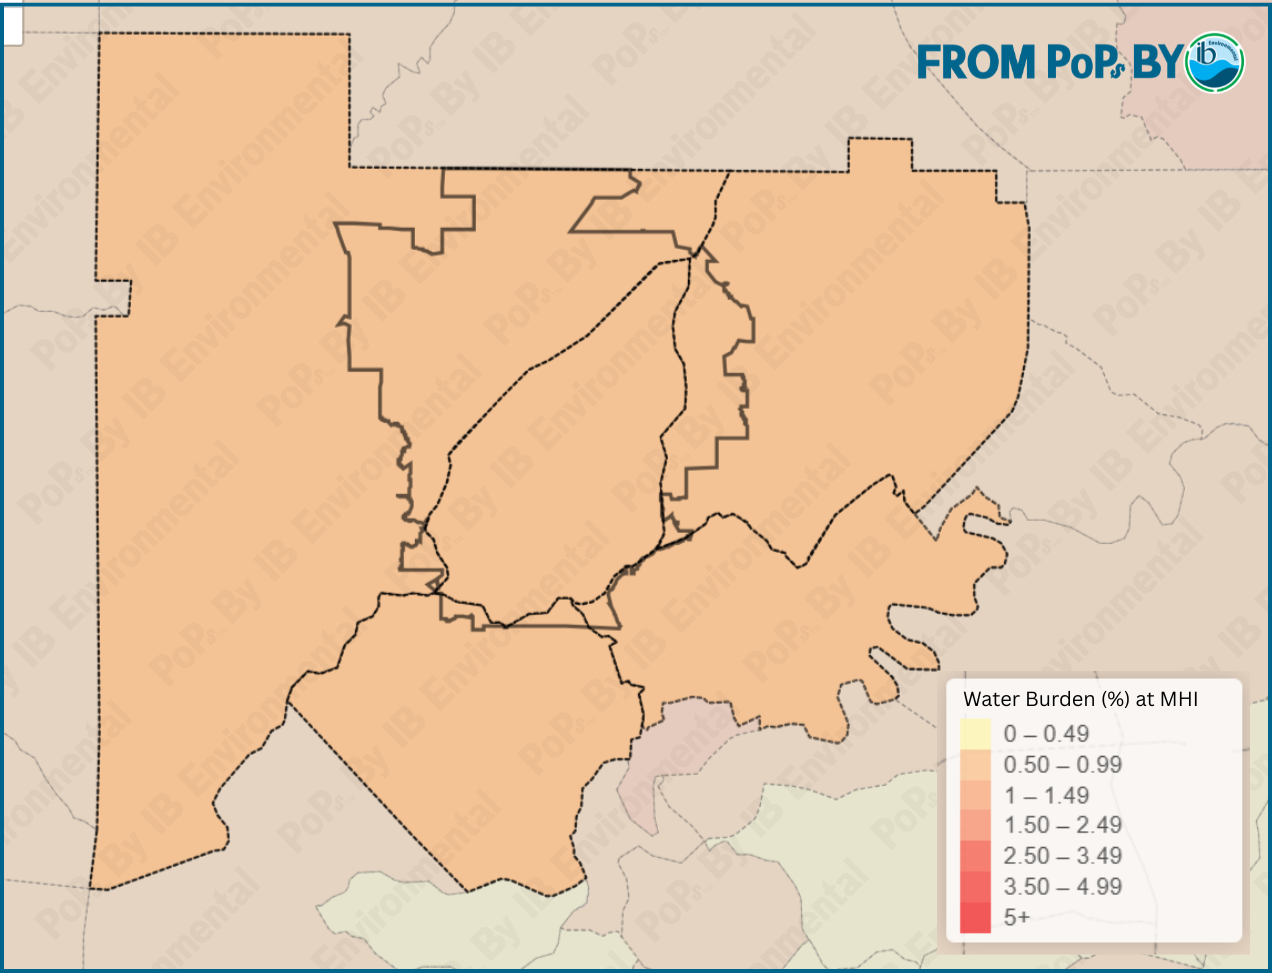
Figure 2: Monthly Water Burden as a Percent of Median Household Income
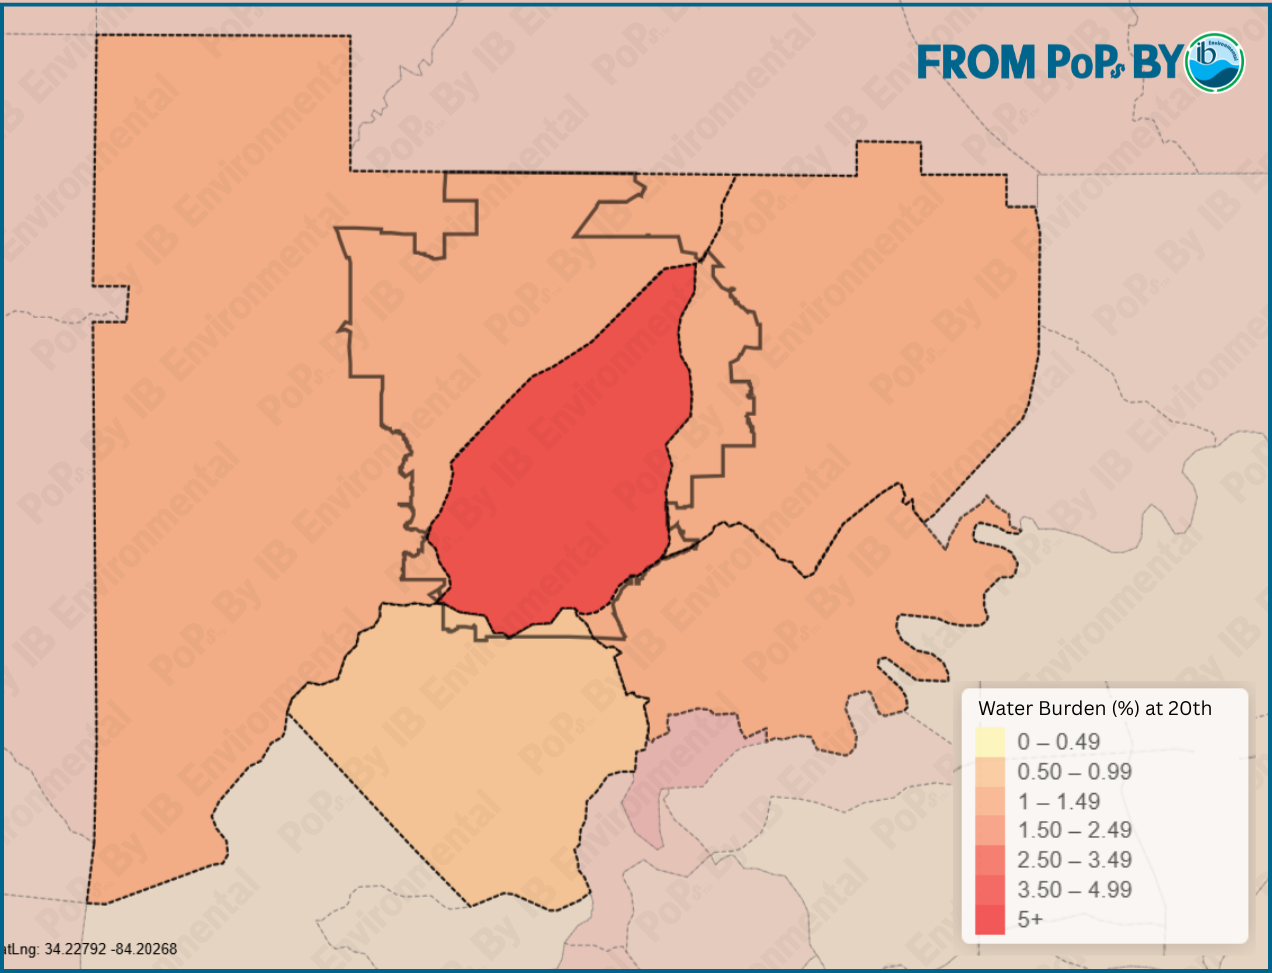
Figure 3: Monthly Water Burden as a Percent of 20th Percentile Household Income
From Averages to Equity: The Case for Finer-Scale Analysis
By using tailored service boundaries and incorporating actual bill data, our PoPs™ model provides a more precise and inclusive view of affordability within communities. The maps above highlight the value of this specificity. In Figure 1, assessing water burden at the median level suggests uniformity across Census Tracts. However, Figure 2—focusing on the 20th percentile—reveals stark disparities that would otherwise go unnoticed. These insights emphasize the importance of localized, data-driven approaches for identifying vulnerable populations and guiding more equitable water affordability strategies.
Subscribe Here
Sign up with your email address to receive notices of new blog updates. We post about once per month.